1 School of Mechanical Engineering, Southwest Jiaotong University, Chengdu 610031, China
2 Vehicle Measurement Control and Safety Key Laboratory of Sichuan Province, Xihua University, Chengdu 610039, China
Corresponding author: huanghaibo214@swjtu.edu.cn
|
Article Type Access License Received Revised Accepted Published Online DOI Copyright |
Abstract. Accurately predicting the sound insulation performance of a system is of great significance for the development of automotive noise, vibration, and harshness (NVH) performance. However, traditional numerical simulation methods are computationally expensive, while purely data-driven models often suffer from stability issues and lack of physical consistency when dealing with complex structures. To address this issue, this paper proposes a sound intensity-guided gated recurrent unit (SI-GRU) model for predicting the sound insulation of automotive floor systems by embedding sound intensity, a key indicator of sound insulation performance, as prior knowledge into the gated recurrent unit (GRU) network architecture. This approach enhances the model's stability and robustness during the frequency-domain learning process. Experimental results indicate that various deep learning models can effectively capture the overall trend of sound insulation performance as a function of frequency. Compared to benchmark models such as GRU, LSTM, and 1D-CNN, the proposed SI-GRU achieves superior results across evaluation metrics including RMSE, MAE, and MedAE, with a 2.5% reduction in RMSE prediction error relative to the GRU network. In the mid-to-high frequency range, where NVH performance is most critical, the model can stably control the relative error within approximately 6%–7%. The results demonstrate that combining domain knowledge with data-driven models can effectively improve the reliability and engineering applicability of sound insulation prediction, providing an efficient predictive method to replace high-cost numerical simulations. |
Keywords: NVH; automotive sound insulation system; sound insulation prediction; GRU
Key Takeaways
- SI-GRU injects sound-intensity prior knowledge into GRU-based frequency-domain prediction for vehicle floor sound insulation.
- Compared with GRU, LSTM, and 1D-CNN baselines, the reported results show stronger overall error performance and better robustness.
- The approach is positioned as a faster engineering alternative to high-cost numerical simulation in NVH-oriented sound insulation studies.
1. Introduction
As consumer demands for cabin comfort and interior quietness continue to rise, researchers are constantly exploring ways to improve automotive chassis sound insulation technology. As one of the major systems responsible for noise transmission in vehicles, the automotive chassis is a critical component along the primary transmission paths of airborne noise [1,2]. Previously, due to the masking effect of engine noise in internal combustion engine vehicles, occupants were less sensitive to road noise. However, since the noise generated by electric vehicle motors is significantly lower than that of internal combustion engines, road noise produced during electric vehicle operation makes occupants more sensitive to it [3,4]. Therefore, this study focuses on predicting the sound insulation performance of floor sound insulation systems and provides corresponding prediction methods.
In research on automotive floor systems, experimental testing and simulation methods are two key approaches for evaluating and optimizing sound insulation performance. Liu et al. [5] conducted experimental tests on vehicle carpets using an impedance tube to measure sound absorption coefficients and transmission loss, and compared and analyzed the contributions of different material combinations to acoustic performance through theoretical models. John [6] addressed the acoustic optimization of vehicle floor carpet systems by establishing a material parameter database and a virtual modeling verification system. Through structural improvements and optimized design, he enhanced sound insulation and sound absorption performance while ensuring controllable weight and cost. While experimental testing provides an intuitive means of assessing the sound insulation performance of the chassis, discrepancies between test conditions and actual driving environments, coupled with the nonlinear and time-varying characteristics of in-vehicle noise sources, often result in significant testing errors. Additionally, the testing process typically requires substantial time and high costs, limiting its widespread application in practical engineering [7,8]. With the advancement of computer technology, simulation methods have been increasingly adopted by researchers for the sound insulation and optimization of automotive chassis systems. Zhang et al. [9] developed a simulation model of the chassis sound insulation system based on FEM, simulating the vibration characteristics of the chassis and body structure as well as sound propagation paths, and analyzed the impact of different structural sound insulation materials on acoustic performance. Deng et al. [10] predicted the sound insulation performance of a sealing specimen and an actual automotive door sealing system by establishing a hybrid finite element-statistical energy analysis (FE-SEA) model. Simulation methods have, to some extent, addressed the shortcomings of experimental methods; however, due to the complex coupled effects in automotive sound insulation systems, issues such as the difficulty in defining boundary conditions for simulation models and the uncertainty of material parameters can also affect the accuracy of the models and the reliability of the prediction results [11,12]. In summary, existing experimental and simulation methods for predicting automotive underbody sound insulation systems suffer from limitations in efficiency and accuracy, and involve high costs; therefore, it is necessary to explore more efficient, economical, and reliable alternative solutions.
Compared to traditional experimental testing and simulation methods, data-driven approaches can process large amounts of experimental data in a short period of time, significantly reducing modeling and prediction times. Unlike traditional physical modeling and simulation methods, data-driven approaches do not require precise mathematical formulas and can efficiently predict acoustic performance even in the absence of explicit physical models [13,14]. Noise transmission in vehicle sound insulation systems often involves complex nonlinear relationships that are difficult to accurately describe using traditional physical models. Wu et al. [15] employed a deep convolutional neural network (CNN) model to predict noise levels at different locations inside the vehicle; this model can adaptively adjust the weights of input data and achieve good predictive results. Wang et al. [16] used SVM to classify the performance of different sound-insulating materials, accurately predicting the sound-insulation effects of each material in practical applications. Ma et al. [17] proposed a convolutional neural network based on adaptive weighted feature learning. Using a data-driven approach, they performed predictive analysis of the sound insulation performance of the entire front acoustic package system based on the original parameters of the front acoustic package components. The data-driven method can not only be used for prediction but also to identify optimal sound insulation design solutions through optimization algorithms. The integrated nature of this method gives it great potential for practical engineering applications. Peng et al. [18] developed a hierarchical multi-objective prediction system incorporating a one-dimensional CNN model to predict the sound insulation performance of automotive underbody acoustic packages. Testing demonstrated that the proposed one-dimensional CNN model provides more accurate and efficient predictions for automotive floor acoustic systems compared to results obtained using two-dimensional CNNs and support vector regression models. Huang et al. [19] noted that current research on acoustic packages largely focuses on data-driven aspects while neglecting the knowledge attributes underlying acoustic package design. They proposed a Long Short-Term Memory (LSTM) model based on adaptive learning rates, employing a multi-objective approach as a knowledge model, and developed an acoustic package system encompassing component-level, system-level, and path-level analyses. Data-driven methods for predicting automotive sound insulation systems offer significant efficiency advantages over experimental simulation methods. However, data-driven methods rely on large volumes of high-quality datasets. In practical applications, obtaining comprehensive and accurate in-vehicle noise data is often fraught with difficulties. In particular, collecting high-dimensional, diverse data under complex operating conditions is costly and may even involve issues such as data missingness or imbalance [20,21]. Furthermore, data-driven models typically ignore physical mechanisms during prediction, relying solely on statistical relationships between inputs and outputs. This leads to unstable model performance when faced with scenarios outside the distribution of training data, resulting in a loss of generalization ability.
In recent years, data-driven methods have been widely applied in the fields of artificial intelligence and machine learning. By analyzing and mining large amounts of data, these methods can identify patterns, predict trends, and demonstrate strong performance across numerous application scenarios. However, they have significant shortcomings in integrating domain knowledge, causing data-driven models to deviate from professional domains and physical rules. McCarthy et al. [22] noted that when using traditional data-driven methods to extract information and predict noise models in acoustic research, issues such as noise, missing data, or data imbalance directly impact model performance and stability. Jiang et al. [23] pointed out that since data-driven methods extract information directly from data, they tend to capture correlations rather than causal relationships, making it difficult for models to provide credible explanations in complex scenarios. Afifi et al. [24] pointed out that data-driven methods rely on large-scale, high-quality datasets; without domain knowledge guidance, these methods may amplify biases present in the data, compromising the fairness and reliability of results. Fan et al. [25] predicted the ultra-high-cycle fatigue life of structures by integrating data-driven approaches with physical principles, demonstrating that incorporating physical principles improves the model's predictive accuracy. Pang et al. [26] introduced empirical knowledge of in-vehicle noise into a data-driven model designed to study noise caused by uneven road surfaces, thereby establishing a mechanism- and data-driven model that improved prediction accuracy. The approach of combining external empirical knowledge with data-driven methods can reduce data requirements and minimize model uncertainty; currently, this method is also receiving widespread attention in practical engineering research and applications.
To address the aforementioned issues, this paper integrates sound intensity (SI) calculation methods with empirical knowledge of automotive sound insulation systems and introduces a gated recurrent unit (GRU) to construct a sound-intensity-guided gated recurrent unit (SI-GRU) prediction model. This model not only reduces the reliance on large-scale data inherent in traditional data-driven methods but also further improves prediction accuracy, providing a new technical approach for predicting sound insulation performance in data-constrained scenarios. The main contributions of this paper are as follows: (1) A physics-guided recurrent neural network model incorporating sound intensity mechanisms is proposed for predicting the sound insulation performance of automotive floor sound insulation systems. By integrating prior knowledge from the field of acoustics into the GRU architecture, the model exhibits greater physical consistency and training stability when learning complex structure–sound coupling relationships. (2) A systematic model evaluation framework oriented toward sound insulation frequency characteristics was established. Through multi-frequency error distribution analysis and the combined evaluation of absolute and relative errors, the model's predictive capabilities and error evolution patterns across different frequency bands were systematically revealed, providing an efficient and practical data-driven solution for rapid sound insulation performance assessment.
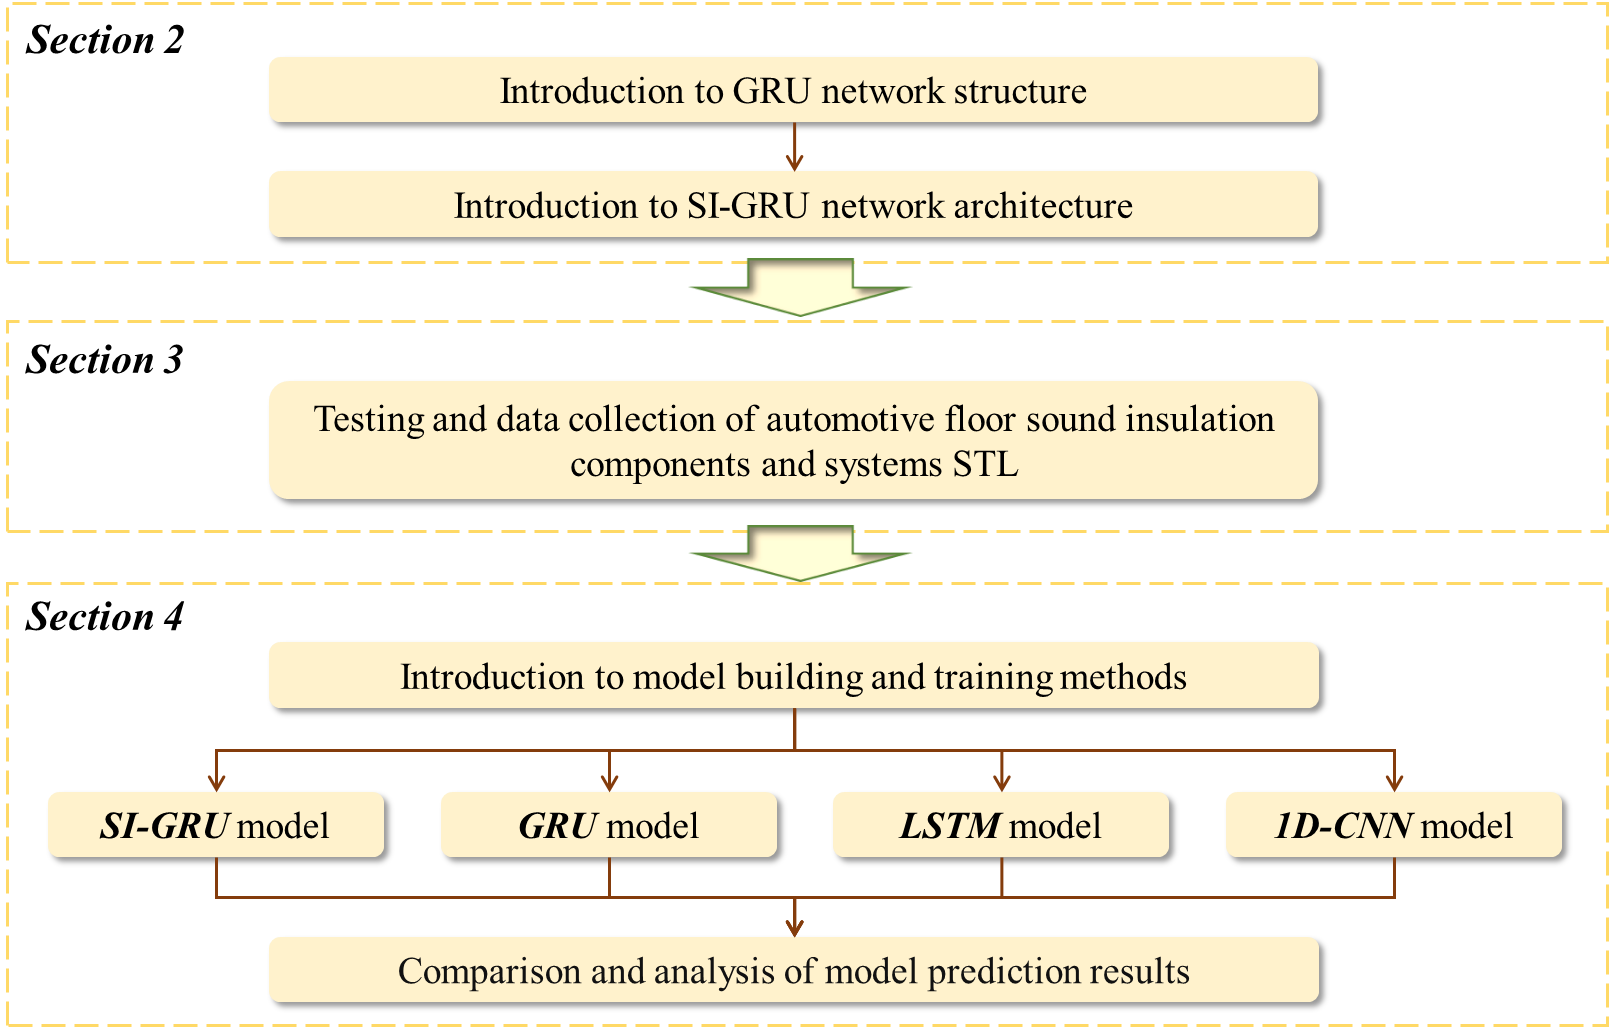
This paper is organized into the following sections: Section 2 introduces the specific computational process of the GRU network and proposes the SI-GRU network by incorporating an empirical gate; Section 3 details the specific workflow for collecting in-vehicle noise test data; Section 4 uses the SI-GRU method to predict in-vehicle noise and compares the results with those of GRU, LSTM, and 1D-CNN networks; Section 5 presents conclusions based on the preceding results; the specific workflow is illustrated in Fig. 1.
2. Method
2.1. Introduction to GRU Networks
The GRU network is essentially a type of recurrent neural network (RNN). It is commonly used to address issues such as the lack of long-term memory in RNNs and gradient vanishing during backpropagation. Its function is similar to that of the LSTM network, but it is simpler in structure. The GRU network model primarily consists of two gates: the reset gate and the update gate [27,28]. The GRU unit is shown in Fig. 2.
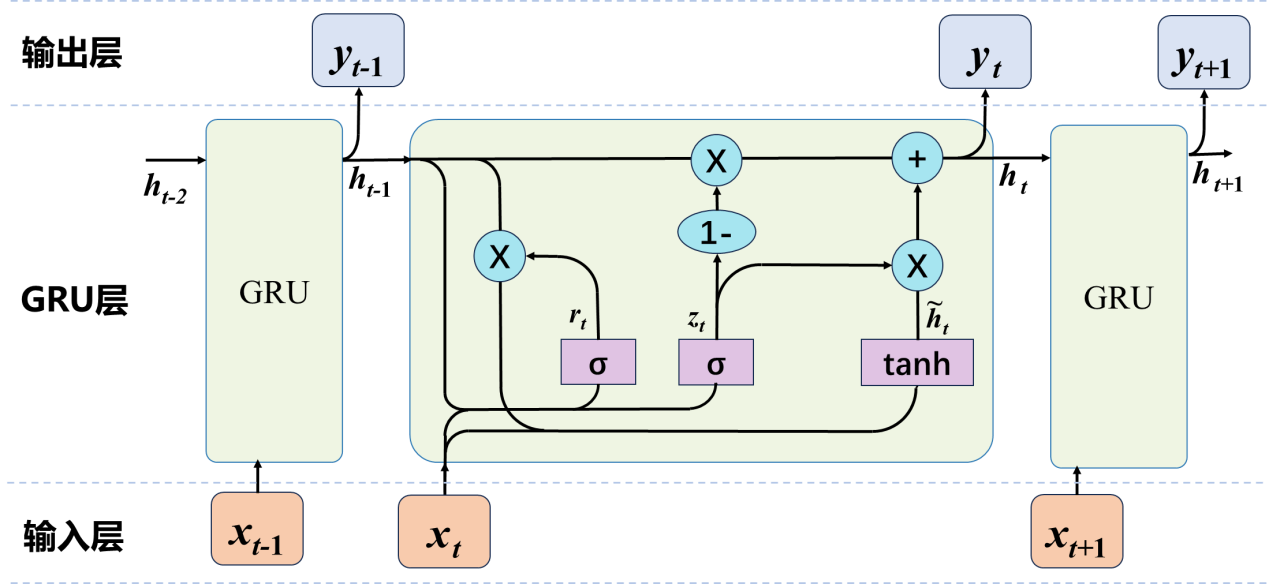
In Fig. 2, \(x_t\) represents the input at the current time step, \(h_{t-1}\) the hidden state from the previous time step, \(\tilde{h}_t\) the candidate hidden state, \(h_t\) the hidden state passed to the next time step, \(r_t\) the reset gate, \(z_t\) the update gate, \(\sigma\) the sigmoid function, and \(\tanh\) the hyperbolic tangent function. The reset gate \(r_t\) determines how the new input is combined with the previous memory, and its calculation formula is as follows:
\[r_t = \sigma\left(W_r \cdot [h_{t-1}, x_t]\right)\]
\[\tilde{h}_t = \tanh\left(W \cdot [r_t * h_{t-1}, x_t]\right)\]
In Equation 1, \(W_r\) and \(W\) are weight matrices. The reset gate uses the sigmoid function to update the hidden state based on the current input, and the resulting \(r_t\) value is then used with \(\tanh\) to compute the candidate hidden state \(\tilde{h}_t\).
The update gate \(z_t\) controls how much information from the previous state is retained in the current state and is primarily used for memory updating.[29,30] Through Equation 2, \(z_t\) is obtained by applying the sigmoid function to the weight matrix \(W_z\), the input \(x_t\), and the previous hidden state \(h_{t-1}\). The hidden state \(h_t\) passed to the next time step is then formed by combining the retained information from \(h_{t-1}\) with the candidate hidden state \(\tilde{h}_t\).
\[z_t = \sigma\left(W_z \cdot [h_{t-1}, x_t]\right)\]
\[h_t = (1-z_t) * h_{t-1} + z_t * \tilde{h}_t\]
Based on the computed hidden layer, normalization is performed using the \(\mathrm{softmax}\) function to transform the output into a probability distribution. According to Equation 3, \(y_t\) is the output at the current time step \(t\), typically a probability distribution; \(W_o\) is the output-layer weight matrix used to map the GRU hidden state to the output space; and \(b_o\) is the output-layer bias term used to adjust the output.
\[y_t = \mathrm{softmax}(W_o h_t + b_o)\]
Through this mechanism, the GRU network improves training and prediction efficiency with fewer gating structures and can accurately capture effective information over longer time spans when processing long sequences [31,32]. However, GRU networks are highly sensitive to hyperparameters when handling small-sample and high-noise data; therefore, external expertise must be incorporated to tune the hyperparameters and achieve optimal performance.
2.2. Introduction to the SI-GRU Method
In the performance modeling of automotive sound insulation systems, traditional GRU networks primarily rely on statistical correlations between inputs and outputs for prediction, lacking an effective representation of physical mechanisms. This leads to model instability or significant prediction errors when data distributions change. To enhance the generalization capability and physical interpretability of automotive sound insulation system performance modeling, this paper proposes an improved model, SI-GRU, that incorporates physical knowledge. By integrating sound intensity calculation methods into the model and using it as key physical information in the input, the model helps capture the true temporal evolution patterns. Compared to the traditional sound pressure level, sound intensity incorporates both the magnitude and directionality of sound energy, enabling the characterization of sound energy propagation paths to help identify areas of poor sound insulation. It also directly describes the sound energy flux density per unit area, offering stronger physical representativeness [33,34]. The formula for sound intensity is as follows:
\[I = \frac{p_{\mathrm{rms}}^2}{\rho c}\]
Where \(I\) is the sound intensity, \(p_{\mathrm{rms}}\) is the effective sound pressure level (the one-third-octave-band sound pressure levels used in this paper are effective sound pressure levels), \(\rho\) is the density of air, and \(c\) is the speed of sound.
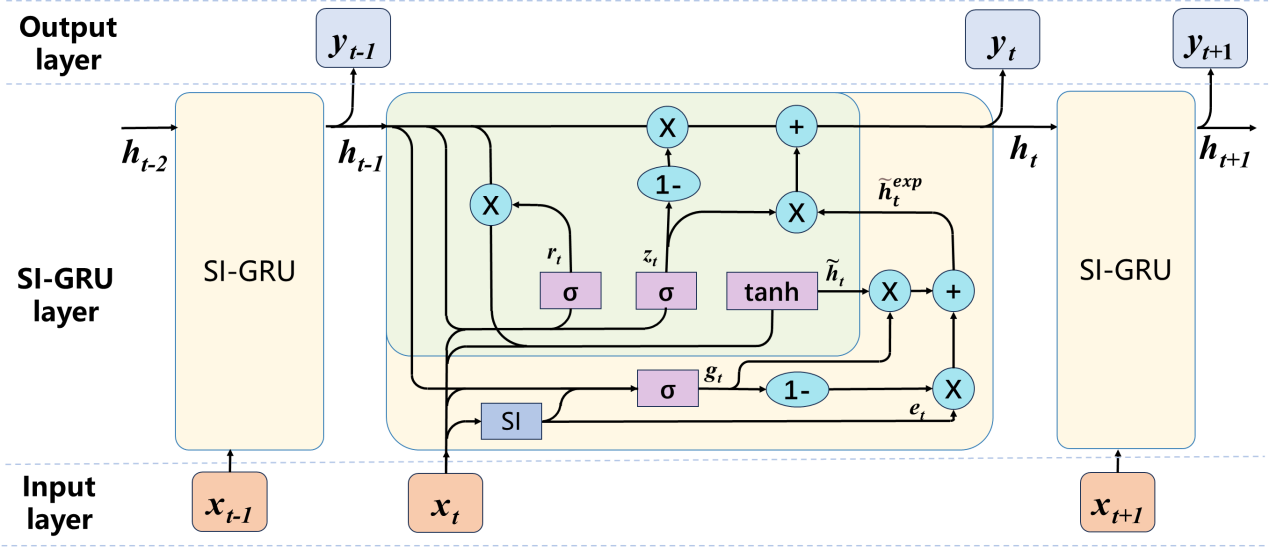
By combining sound intensity with the hidden state information of the GRU, external experience data is dynamically integrated into the model. Its main unit structure is shown in Fig. 3. Here, the experience gate \(g_t\) is obtained by applying a sigmoid function to the weight matrix \(W_g\), the input information \(x_t\), the previous hidden state \(h_{t-1}\), and the external experience information \(e_t\). The experience gate \(g_t\) is then combined with the candidate hidden state \(\tilde{h}_t\). The contribution of the external experience information \(e_t\) to the candidate hidden state is controlled via \(g_t\), resulting in an experience-enhanced candidate hidden state \(\tilde{h}_t^{\mathrm{exp}}\). Finally, \(\tilde{h}_t^{\mathrm{exp}}\) is combined with the update gate \(z_t\) to form the hidden state \(h_t\) for the next time step.
\[g_t = \sigma\left(W_g \cdot [h_{t-1}, x_t, e_t]\right)\]
\[\tilde{h}_t^{\mathrm{exp}} = g_t * \tilde{h}_t + (1-g_t) * e_t\]
\[h_t = (1-z_t) * h_{t-1} + z_t * \tilde{h}_t^{\mathrm{exp}}\]
After calculating the hidden state information \(h_t\) to be passed to the next time step, the SI-GRU hidden state is mapped to the output space using the same output calculation method as GRU, as described in Equation 3, to produce the current time-step output value.
3. Experiment
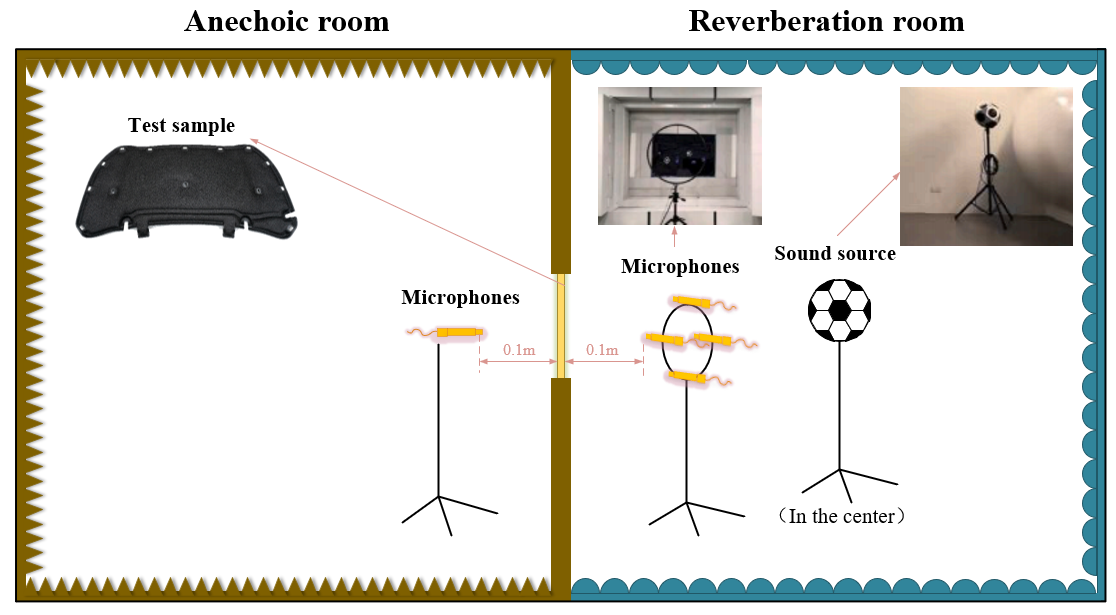
In automotive sound insulation systems, sound insulation index is commonly used to evaluate the system's sound insulation performance; this index is also referred to as the system's STL. The sound insulation performance of an automotive floor system is determined by the combined STL of the sound insulation components that make up the system. These components consist of the STL of the sheet metal and the STL of the sound-absorbing mats laid on top of the sheet metal [35,36]. According to the specific STL testing methods provided in ISO 10140-2:2010 [37], a reverberation chamber-anechoic chamber combination is used to test the sound insulation performance of various floor materials. The test consists of two main areas: the reverberation chamber and the anechoic chamber. A sound source is generated in the reverberation chamber and received in the anechoic chamber; the STL is calculated by measuring the attenuation of the noise source between the source chamber and the receiving chamber [38]. During testing, the material or component under test is mounted on the partition wall between the reverberation chamber and the anechoic chamber, and fixtures and sealing putty are used to prevent sound leakage. Simultaneously, a dodecahedral spherical sound source is placed at the center of the reverberation chamber to generate white noise with a total sound pressure level of 120 dB. The STL of the test specimen is calculated by measuring the difference in sound power between the anechoic chamber and the reverberation chamber [39,40]. As shown in Fig. 4, before conducting sound insulation performance tests, it is first necessary to match and combine sheet metal and carpet materials of different thicknesses according to the design scheme. A three-dimensional testing method is then used to determine the proportion of each thickness of sheet metal and carpet within the target area, thereby accurately describing the material distribution characteristics of the sound insulation system [41,42]. After configuration, this composite structure is tested as an independent sample to measure sound insulation performance, thereby generating a data set with a clear correlation between structural parameters and performance metrics. Tables 1 and 2 respectively show the composition ratios of sheet metal and carpet materials of different thicknesses for five of these samples. Next, tests were conducted on the STLs for different thicknesses of sheet metal material, different types and thicknesses of sound insulation pads, and the floor system used in the floor sound insulation system. Using spectral analysis methods, the sound pressure level distribution characteristics for each 1/3-octave band were extracted. Fig. 5 shows the STLs for different thicknesses of sheet metal material and different types and thicknesses of sound insulation pads; Fig. 6 shows the STL for the floor system.
| Thickness (mm) | Area ratio | ||||
|---|---|---|---|---|---|
| Sample 1 | Sample 2 | Sample 3 | Sample 4 | Sample 5 | |
| 0.65 | 0.89 | 0.85 | 0.94 | 0.90 | 0.82 |
| 0.7 | 0.01 | 0.00 | 0.00 | 0.00 | 0.03 |
| 0.8 | 0.00 | 0.00 | 0.00 | 0.01 | 0.01 |
| 0.9 | 0.00 | 0.02 | 0.03 | 0.00 | 0.00 |
| 1 | 0.00 | 0.01 | 0.00 | 0.00 | 0.01 |
| 1.1 | 0.00 | 0.00 | 0.00 | 0.00 | 0.00 |
| 1.2 | 0.00 | 0.00 | 0.02 | 0.02 | 0.03 |
| 1.3 | 0.00 | 0.01 | 0.00 | 0.01 | 0.03 |
| 1.4 | 0.00 | 0.00 | 0.01 | 0.00 | 0.00 |
| 1.5 | 0.03 | 0.03 | 0.00 | 0.00 | 0.00 |
| 1.6 | 0.02 | 0.00 | 0.00 | 0.00 | 0.02 |
| 1.7 | 0.03 | 0.02 | 0.00 | 0.00 | 0.00 |
| 1.8 | 0.00 | 0.03 | 0.00 | 0.01 | 0.00 |
| 1.9 | 0.00 | 0.01 | 0.00 | 0.00 | 0.00 |
| 2 | 0.00 | 0.01 | 0.00 | 0.01 | 0.00 |
| 2.1 | 0.00 | 0.00 | 0.00 | 0.03 | 0.03 |
| 2.2 | 0.00 | 0.01 | 0.01 | 0.00 | 0.02 |
 (a) |  (b) |
| Thickness (mm) | Area ratio | ||||
|---|---|---|---|---|---|
| Sample 1 | Sample 2 | Sample 3 | Sample 4 | Sample 5 | |
| 0 | 0.00 | 0.00 | 0.00 | 0.00 | 0.00 |
| 5 | 0.00 | 0.03 | 0.04 | 0.00 | 0.02 |
| 10 | 0.06 | 0.09 | 0.07 | 0.07 | 0.08 |
| 15 | 0.52 | 0.40 | 0.44 | 0.44 | 0.42 |
| 20 | 0.00 | 0.00 | 0.03 | 0.00 | 0.04 |
| 25 | 0.11 | 0.13 | 0.08 | 0.08 | 0.05 |
| 30 | 0.03 | 0.00 | 0.05 | 0.00 | 0.05 |
| 35 | 0.13 | 0.11 | 0.14 | 0.19 | 0.14 |
| 40 | 0.16 | 0.24 | 0.15 | 0.22 | 0.20 |

4. Model Development and Prediction
4.1. Development of the SI-GRU Model
By testing the sound insulation data of sheet metal and sound insulation pads of different thicknesses, and separately collecting the STL values for the six subsystems of the chassis and the chassis system as a whole, we formed separate datasets for each sample. Preprocessing the collected raw data effectively reduces data noise, improves data quality, and eliminates the influence of data magnitude on the neural network's prediction results [43,44]. Preprocessing primarily involves normalizing the data input to the prediction model, using the normalized data for model training and prediction, and finally denormalizing the prediction results back to their original magnitude [45,46]. Normalization is the process of scaling feature data with different dimensions or numerical ranges to a specific range (between [0,1]); the formulas for normalization and denormalization are shown in Equation (6).
\[X_{\mathrm{std}} = \frac{x_i - X_{\min}}{X_{\max} - X_{\min}}\]
\[X_{\mathrm{scaled}} = X_{\mathrm{std}} \times (X_{\max} - X_{\min}) + X_{\min}\]
Where \(X_{\mathrm{std}}\) is the normalized value, \(x_i\) is the value for each data point, \(X\) is the original dataset, \(X_{\max}\) is the maximum value in the original dataset, \(X_{\min}\) is the minimum value in the original dataset, and \(X_{\mathrm{scaled}}\) is the denormalized value.
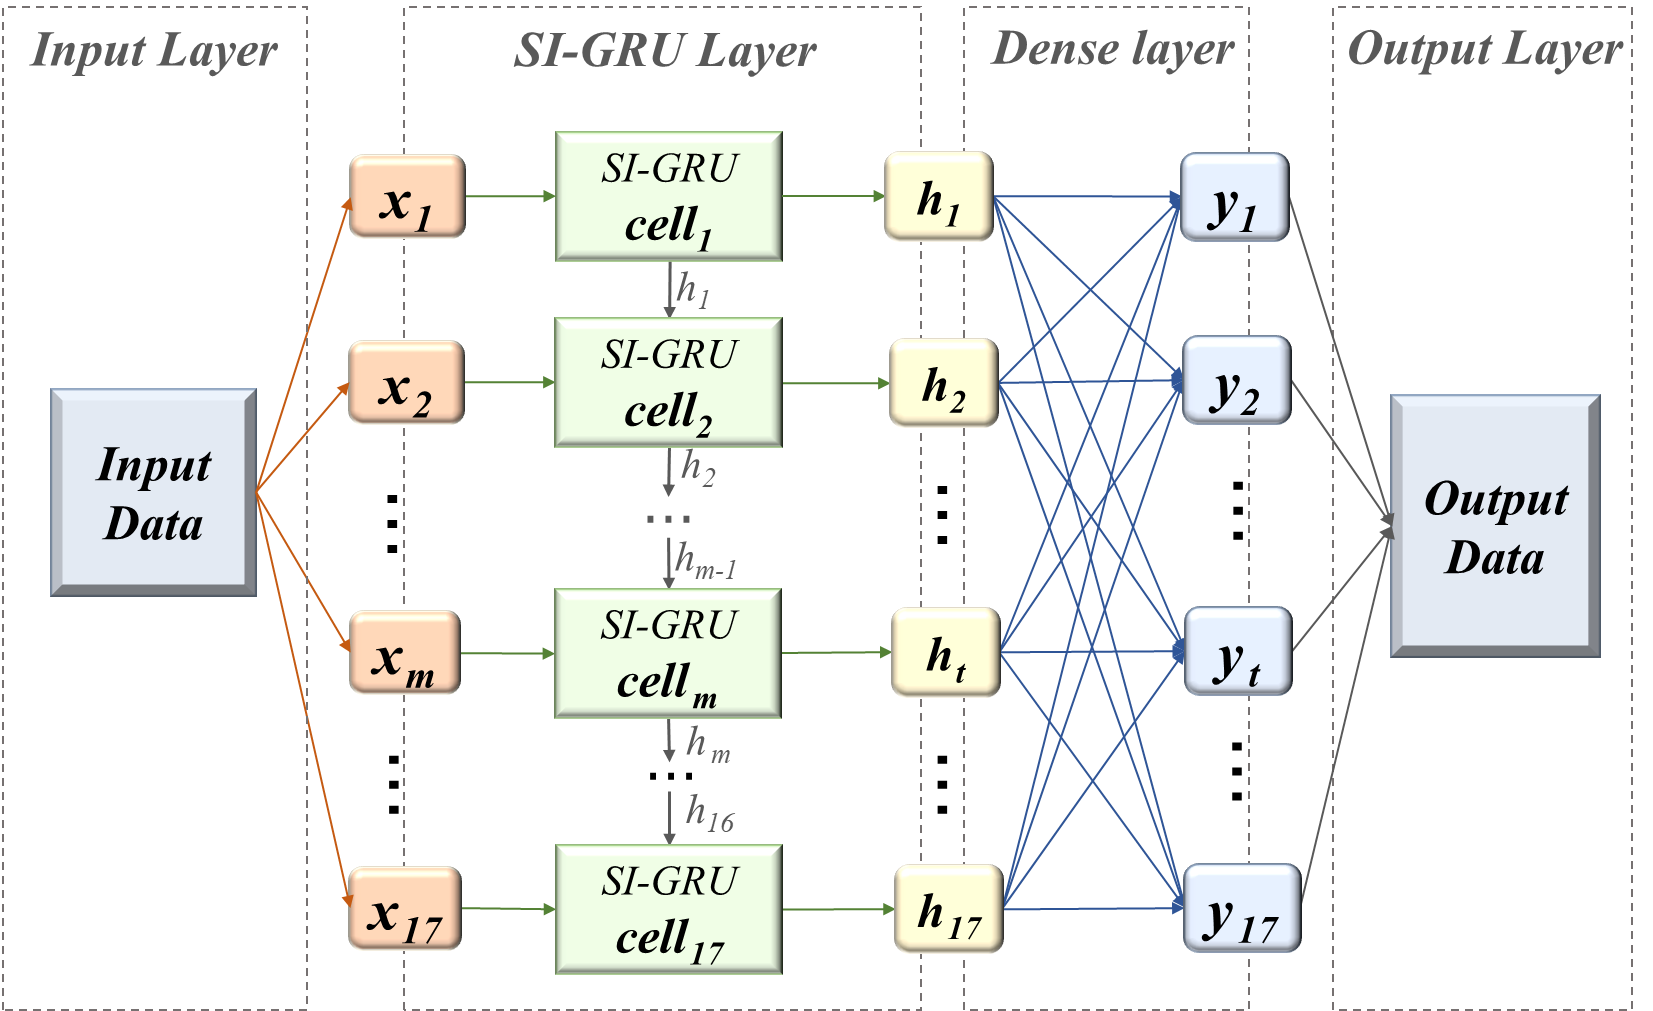
Due to the limited number of available samples, a K-fold cross-validation strategy combined with an independent test set was employed to ensure the reliability of the performance evaluation [47,48]. The complete dataset consists of 140 samples, of which 112 samples (80%) were used for model development, while the remaining 28 samples (20%) served as an independent test set and were not included in any training or hyperparameter tuning processes. These 112 training samples were further subjected to 5-fold cross-validation. In each fold, approximately 90 samples were used to train the SI-GRU network, and the remaining 22 samples were used for validation. Model hyperparameters and training strategies were determined based on the average performance across the five-fold validation. After model selection, the SI-GRU model was retrained using all 112 training samples, and a final evaluation was conducted on the independent test set. Following the dataset partitioning, the SI-GRU network was deployed to analyze the automotive chassis sound insulation system problem, with 17 one-third octave bands corresponding to different thicknesses of sheet metal material STL, different types and thicknesses of sound insulation pads STL (STL files of sheet metal materials of varying thicknesses and sound insulation pads of different types and thicknesses) as model inputs, with the 1/3-octave band frequencies of the floor system STL serving as the model outputs. A single-layer SI-GRU network was selected as the overall model framework to predict the floor sound insulation performance. The model output consists of results processed by the SI-GRU network and passed through a fully connected layer, corresponding to the predicted values of the system at each 1/3-octave band frequency. A schematic diagram of the model structure is shown in Fig. 7. The software used for model development is PyCharm 2023.2, and the computer hardware configuration is as follows: CPU: 13th Gen Intel Core i7-13700HX; GPU: NVIDIA GeForce RTX 4060; RAM: 16.0 GB.
4.2. Analysis of Prediction Results
This section compares the predictive performance of four models—SI-GRU, GRU, LSTM, and 1D-CNN—under the assumption that all models use fixed weights. All models were trained using the same dataset split and training settings. The structure of SI-GRU is described in detail in Section 4.1; the GRU adopts a single-layer structure with a main architecture identical to that of SI-GRU; the 1D-CNN comprises two convolutional layers (the first layer with 2 input channels and the second with 6 input channels, both using 3×3 convolutional kernels with padding=1), followed by adaptive average pooling and a fully connected layer; the LSTM also adopts a single-layer structure with 128 hidden units. The Adam optimizer was used for training all models, with an initial learning rate of 0.001 and a total of 200 training epochs.
In the experiment, mean absolute error (MAE), root mean squared error (RMSE), and median absolute error (MedAE) were used as evaluation metrics for the models. Table 3 summarizes the prediction results of the four models on the test set. Overall, all three baseline models achieved high prediction accuracy, indicating a strong learnable mapping relationship between the system's sound insulation performance and the input features. Among them, the GRU demonstrated the best overall prediction accuracy, with both its MAE and RMSE slightly lower than those of the LSTM and 1D-CNN, while its MedAE was comparable to that of the LSTM but superior to that of the 1D-CNN. Compared to LSTM, GRU exhibits smaller values and more stable fluctuations across all error metrics, demonstrating better prediction consistency. Therefore, this paper selects GRU as the baseline model for improvement. Based on this, the proposed SI-GRU achieves the best results across all evaluation metrics, with its MAE, RMSE, and MedAE reduced by approximately 2.0%, 2.5%, and 6.0% compared to GRU, respectively. Although the numerical improvements are relatively modest, further reducing errors becomes increasingly challenging when the model's overall prediction accuracy is already at a high level. This indicates that the introduced sound intensity mechanism can effectively enhance prediction stability without significantly increasing model complexity. In particular, the substantial improvement in MedAE demonstrates that this method performs more robustly in suppressing outlier samples, thereby reducing the impact of extreme prediction errors on overall performance.
| Model | MAE (dB) | RMSE (dB) | MedAE (dB) |
|---|---|---|---|
| SI-GRU | 3.591 | 2.820 | 2.268 |
| GRU | 3.664 | 2.893 | 2.413 |
| LSTM | 3.687 | 2.908 | 2.413 |
| 1D-CNN | 3.695 | 2.943 | 2.461 |
To provide a more intuitive comparison of the predictive performance of each model, Fig. 8 shows a comparison of the prediction results from each model with the actual values across the entire frequency range. It can be seen that all models demonstrate good trend capture capabilities. In terms of absolute error, the prediction deviation of SI-GRU is generally within ±1.5 dB at most frequency points, with a maximum deviation of 2.52 dB (at 800 Hz). Fig. 9 further illustrates the distribution of relative errors across 17 frequency points, where the error bars represent the error range of the test samples. It is worth noting that although the relative error in the low-frequency band (<500 Hz) is relatively high—with SI-GRU ranging from approximately 11.3% to 20.2% and the comparison models generally reaching 12.9% to 27.7%—the sound insulation values themselves are at a relatively low level of 20–27 dB. Consequently, even with a certain degree of deviation, the corresponding absolute error remains within 2.5 dB. Therefore, on the absolute scale shown in Fig. 8, low-frequency errors do not exhibit a significant trend of amplification. This phenomenon primarily stems from the fact that at low frequencies, the structural-acoustic coupling system exhibits denser modal characteristics, making it more sensitive to boundary conditions and parameter perturbations, which leads to increased response uncertainty—a common challenge in sound insulation prediction. As the frequency increases, the relative errors of all models generally show a gradual downward trend. In the 1000–5000 Hz frequency band, the relative error of SI-GRU remains largely between 5.9% and 6.9%, which is significantly lower than the 6.2%–8.4% for GRU and LSTM and the 6.4%–8.9% for 1D-CNN. Overall, SI-GRU exhibits a superior error distribution across all frequency bands. Additionally, this model features a shorter error tail and lower dispersion, consistent with the results showing significant improvements over MedAE. This indicates that the proposed method not only enhances average prediction accuracy but also effectively suppresses the occurrence of extreme errors, thereby improving the model's stability and engineering applicability under complex operating conditions.
 (a) |  (b) |
 (c) |  (d) |

5. Conclusion
This paper proposes a Sound Intensity-Guided Recurrent Unit (SI-GRU) model for predicting the sound insulation index of automotive floor systems. By integrating domain-specific acoustic knowledge into the recurrent neural network architecture, the proposed method effectively enhances the model's prediction stability while maintaining high computational efficiency. Experimental results indicate that various deep learning models can effectively capture the overall trend of sound insulation performance as a function of frequency; however, the SI-GRU demonstrates superior comprehensive performance across multiple evaluation metrics. Compared with the baseline GRU model, the SI-GRU model reduced MAE, RMSE, and MedAE by approximately 2.0%, 2.5%, and 6.0%, respectively, indicating that this model possesses greater robustness than GRU in suppressing large prediction errors. Analysis of each prediction frequency point shows that although the relative error is slightly higher in the low-frequency band due to significant structure–acoustic coupling effects and strong modal sensitivity, the absolute deviation is still controlled within an engineering-acceptable range. In the mid-to-high frequency bands, which are more critical for vehicle NVH performance, SI-GRU can stably control the relative error within approximately 5.9%–6.9%, lower than the 6.2%–8.4% of GRU and LSTM, while demonstrating good prediction reliability and engineering applicability.
Overall, the proposed method not only improves average prediction accuracy but also effectively reduces the probability of extreme errors, thereby enhancing the model's stability under complex operating conditions. The results indicate that combining domain knowledge with data-driven models is a promising technical approach for enhancing structural-acoustic prediction capabilities. Future work will further expand the dataset scale, conduct model validation across multiple vehicle platforms, and explore hybrid neural network architectures that incorporate physical mechanisms to continuously improve the model's generalization ability and engineering applicability.
Acknowledgment
The authors would like to express their gratitude to the Sichuan Science and Technology Program (Grant No. 2026YFHZ0230) for its funding and to the Institute of Energy and Power for its support of the experimental research.
Declarations
Funding: This paper was funded by the Sichuan Science and Technology Program (Grant No. 2026YFHZ0230).
Conflict of Interest: The authors declare no competing interests.
Data and Code Availability: Data are contained within the article.
AI Tool Disclosure: No generative AI tools were used.
References
- H. Huang, T. C. Lim, J. Wu, W. Ding, and J. Pang, “Multitarget prediction and optimization of pure electric vehicle tire/road airborne noise sound quality based on a knowledge-and data-driven method,” Mechanical Systems and Signal Processing, vol. 197, 2023, Art. no. 110361, doi: 10.1016/j.ymssp.2023.110361.
- M. Yang, P. Dai, Y. Yin, D. Wang, Y. Wang, and H. Huang, “Predicting and optimizing pure electric vehicle road noise via a locality-sensitive hashing transformer and interval analysis,” ISA Transactions, vol. 157, pp. 556-572, 2025, doi: 10.1016/j.isatra.2024.11.059.
- J. Masri, M. Amer, S. Salman, M. Ismail, and M. Elsisi, “A survey of modern vehicle noise, vibration, and harshness: A state-of-the-art,” Ain Shams Engineering Journal, 2024, Art. no. 102957, doi: 10.1016/j.asej.2024.102957.
- H. Huang, X. Huang, W. Ding, M. Yang, and X. Yu, “Vehicle vibro-acoustical comfort optimization using a multi-objective interval analysis method,” Expert Systems With Applications, vol. 213, 2023, doi: 10.1016/j.eswa.2022.119001.
- Z. Liu, J. Liang, Y. Zhao, D. Gu, M. Fard, and J. L. Davy, “Acoustic performance of a multi-layer vehicle interior trim sound-absorbing material,” in INTER-NOISE and NOISE-CON Congress and Conference Proceedings, vol. 268, no. 7, 2023, pp. 1799-1808, doi: 10.3397/IN_2023_0271.
- T. John, “Design & analysis of acoustically improved vehicle floor carpets,” M.S. thesis, RMIT University, 2024, doi: 10.25439/rmt.27351066.
- N. Oettle and D. Sims-Williams, “Automotive aeroacoustics: An overview,” Proceedings of the Institution of Mechanical Engineers, Part D: Journal of Automobile Engineering, vol. 231, no. 9, pp. 1177-1189, 2017, doi: 10.1177/0954407017695147.
- C. Asensio, J. A. Trujillo, and G. Arcas, “Analysis of the effects of uneven sound coverage over a facade during a sound insulation test according to the international standard ISO 16283-3,” Applied Acoustics, vol. 130, 2018, doi: 10.1016/j.apacoust.2017.09.006.
- Y. Zhang, J. Zhang, Y. Li, D. Yao, Y. Zhao, Y. Ai, W. Pan, and J. Li, “Research progress on thin-walled sound insulation metamaterial structures,” Acoustics, vol. 6, no. 2, pp. 298-330, 2024, doi: 10.3390/acoustics6020016.
- G. Deng, J. Shao, S. Zheng, and X. Wu, “Study on sound transmission loss modeling through simplified sealing specimens and an automotive door sealing system,” Noise Control Engineering Journal, vol. 69, no. 4, pp. 301-330, 2021, doi: 10.3397/1/376929.
- X. Zhang, X. Hu, H. Gong, J. Zhang, Z. Lv, and W. Hong, “Experimental study on the impact sound insulation of cross laminated timber and timber-concrete composite floors,” Applied Acoustics, vol. 161, 2020, Art. no. 107173, doi: 10.1016/j.apacoust.2019.107173.
- J. Almatawah, M. Alrumaidhi, H. Matar, A. Altemeemi, and J. Alhubail, “An interpretable machine learning framework for urban traffic noise prediction in Kuwait: A data-driven approach to environmental management,” Sustainability, vol. 17, no. 19, 2025, Art. no. 8881, doi: 10.3390/su17198881.
- W. Alok, K. Shailendra, K. Bahram, C. Michael, and V. Ganesh, “Data-driven prediction of vehicle cabin thermal comfort: using machine learning and high-fidelity simulation results,” International Journal of Heat and Mass Transfer, vol. 148, 2020, Art. no. 119083, doi: 10.1016/j.ijheatmasstransfer.2019.119083.
- R. Liu, Y. Yin, Y. Peng, and X. Zheng, “Predicting vehicle-engine-radiated noise based on bench test and machine learning,” Machines, vol. 13, no. 8, 2025, Art. no. 724, doi: 10.3390/machines13080724.
- Y. Wu, X. Liu, H. Huang, Y. Wu, W. Ding, and M. Yang, “Multi-objective prediction and optimization of vehicle acoustic package based on ResNet neural network,” Sound and Vibration, vol. 57, no. 1, pp. 73-95, 2023, doi: 10.32604/sv.2023.044601.
- R. Wang, D. Yao, J. Zhang, X. Xiao, and X. Jin, “Sound-insulation prediction model and multi-parameter optimisation design of the composite floor of a high-speed train based on machine learning,” Mechanical Systems and Signal Processing, vol. 200, 2023, Art. no. 110631, doi: 10.1016/j.ymssp.2023.110631.
- Y. Ma, J. Yan, J. Deng, X. Liu, D. Pan, J. Wang, and P. Liu, “The prediction of sound insulation for the front wall of pure electric vehicles based on AFWL-CNN,” Machines, vol. 13, no. 6, 2025, Art. no. 527, doi: 10.3390/machines13060527.
- C. Peng, S. Cheng, M. Sun, C. Ren, J. Song, and H. Huang, “Prediction of sound transmission loss of vehicle floor system based on 1D-convolutional neural networks,” Sound and Vibration, vol. 58, pp. 25-46, 2024, doi: 10.32604/sv.2024.046940.
- H. Huang, X. Huang, W. Ding, S. Zhang, and J. Pang, “Optimization of electric vehicle sound package based on LSTM with an adaptive learning rate forest and multiple-level multiple-object method,” Mechanical Systems and Signal Processing, vol. 187, 2023, Art. no. 109932, doi: 10.1016/j.ymssp.2022.109932.
- J. Zhao, Y. Yin, J. Chen, W. Zhao, W. Ding, and H. Huang, “Evaluation and prediction of vibration comfort in engineering machinery cabs using random forest with genetic algorithm,” SAE Int. J. Veh. Dyn., Stab., and NVH, vol. 8, no. 4, 2024, doi: 10.4271/10-08-04-0027.
- Avalos, “GSA for machine learning problems: A comprehensive overview,” Applied Mathematical Modelling, vol. 92, pp. 261-280, 2021, doi: 10.1016/j.apm.2020.11.013.
- R. A. McCarthy, Y. Zhang, S. A. Verburg, W. F. Jenkins, and P. Gerstoft, “Machine learning in acoustics: A review and open-source repository,” npj Acoustics, vol. 1, no. 1, 2025, Art. no. 18, doi: 10.1038/s44384-025-00021-w.
- Z. Jiang, X. Wang, H. Li, T. Hong, F. You, J. Drgoňa, D. Vrable, and B. Dong, “Physics-informed machine learning for building performance simulation-a review of a nascent field,” Advances in Applied Energy, vol. 18, 2025, Art. no. 100223, doi: 10.1016/j.adapen.2025.100223.
- N. Afifi, C. Wittig, L. Paehler, A. Lindenmann, K. Wolter, F. Leitenberger, M. Dogru, P. Grauberger, T. Düser, A. Albers, and S. Matthiesen, “Data-driven methods and AI in engineering design: A systematic literature review focusing on challenges and opportunities,” arXiv preprint arXiv:2511.20730, 2025, doi: 10.48550/arXiv.2511.20730.
- J. L. Fan, G. Zhu, M. L. Zhu, and F. Z. Xuan, “A data-physics integrated approach to life prediction in very high cycle fatigue regime,” International Journal of Fatigue, vol. 176, 2023, Art. no. 107917, doi: 10.1016/j.ijfatigue.2023.107917.
- J. Pang, T. Mao, W. Jia, X. Jia, P. Dai, and H. Huang, “Prediction and analysis of vehicle interior road noise based on mechanism and data series modeling,” Sound and Vibration, pp. 59-80, 2024, doi: 10.32604/sv.2024.046247.
- R. Dey and F. M. Salem, “Gate-variants of gated recurrent unit (GRU) neural networks,” in 2017 IEEE 60th International Midwest Symposium on Circuits and Systems (MWSCAS), 2017, pp. 1597-1600, doi: 10.1109/MWSCAS.2017.8053243.
- Gharehbaghi, R. Ghasemlounia, F. Ahmadi, and M. Albaji, “Groundwater level prediction with meteorologically sensitive gated recurrent unit (GRU) neural networks,” Journal of Hydrology, vol. 612, 2022, Art. no. 128262, doi: 10.1016/j.jhydrol.2022.128262.
- Xu, J. Shen, X. Du, and F. Zhang, “An intrusion detection system using a deep neural network with gated recurrent units,” IEEE Access, vol. 6, pp. 48697-48707, 2018, doi: 10.1109/ACCESS.2018.2867564.
- T. Chen, P. Lin, and J. Ling, “An intrusion detection method for industrial control system based on gate recurrent unit,” in Journal of Physics: Conference Series, vol. 1302, no. 2, 2019, Art. no. 022016, doi: 10.1088/1742-6596/1302/2/022016.
- S. Gao, Y. Huang, S. Zhang, J. Han, G. Wang, M. Zhang, and Q. Lin, “Short-term runoff prediction with GRU and LSTM networks without requiring time step optimization during sample generation,” Journal of Hydrology, vol. 589, 2020, Art. no. 125188, doi: 10.1016/j.jhydrol.2020.125188.
- G. Shen, Q. Tan, H. Zhang, P. Zeng, and J. Xu, “Deep learning with gated recurrent unit networks for financial sequence predictions,” Procedia Computer Science, vol. 131, pp. 895-903, 2018, doi: 10.1016/j.procs.2018.04.298.
- F. Jacobsen, “Sound intensity,” in Springer Handbook of Acoustics, 2007, pp. 1093-1114, doi: 10.1007/978-1-4939-0755-7_25.
- M. J. Crocker and J. P. Arenas, “Fundamentals of the direct measurement of sound intensity and practical applications,” Acoustical Physics, vol. 49, no. 2, pp. 163-175, 2003, doi: 10.1134/1.1560378.
- J. Mago, Sunali, A. Negi, J. S. Bolton, and S. Fatima, “Sound insulation: key concepts and technologies,” in Handbook of Vibroacoustics, Noise and Harshness, 2024, pp. 1-44, doi: 10.1007/978-981-99-4638-9_27-1.
- J. Liu, T. Chen, Y. Zhang, G. Wen, Q. Qing, H. Wang, R. Sedaghati, and Y. M. Xie, “On sound insulation of pyramidal lattice sandwich structure,” Composite Structures, vol. 208, pp. 385-394, 2019, doi: 10.1016/j.compstruct.2018.10.013.
- Acoustics — Laboratory measurement of sound insulation of building elements — Part 2: Measurement of airborne sound insulation, ISO 10140-2:2010, International Organization for Standardization, Geneva, 2010.
- H. Huang, Y. Wang, J. Wu, W. Ding, and J. Pang, “Prediction and optimization of pure electric vehicle tire/road structure-borne noise based on knowledge graph and multi-task ResNet,” Expert Systems with Applications, vol. 255, 2024, Art. no. 124536, doi: 10.1016/j.eswa.2024.124536.
- N. M. Papadakis and G. E. Stavroulakis, “Review of acoustic sources alternatives to a dodecahedron speaker,” Applied Sciences, vol. 9, no. 18, 2019, Art. no. 3705, doi: 10.3390/app9183705.
- H. Huang, X. Huang, W. Ding, M. Yang, D. Fan, and J. Pang, “Uncertainty optimization of pure electric vehicle interior tire/road noise comfort based on data-driven,” Mechanical Systems and Signal Processing, vol. 165, 2022, Art. no. 108300, doi: 10.1016/j.ymssp.2021.108300.
- C. Long, X. Song, D. Xu, and X. Zhu, “Frequency domain characterisation of the sound insulation performance of wooden doors and optimal design of high performance wooden doors,” Scientific Reports, vol. 15, no. 1, 2025, Art. no. 27620, doi: 10.1038/s41598-025-13223-9.
- H. Zhu, J. Zhao, Y. Wang, W. Ding, J. Pang, and H. Huang, “Improving of pure electric vehicle sound and vibration comfort using a multi-task learning with task-dependent weighting method,” Measurement, vol. 233, 2024, Art. no. 114752, doi: 10.1016/j.measurement.2024.114752.
- R. Dai, J. Zhao, W. Zhao, W. Ding, and H. Huang, “Exploratory study on sound quality evaluation and prediction for engineering machinery cabins,” Measurement, vol. 253, 2025, Art. no. 117684, doi: 10.1016/j.measurement.2025.117684.
- L. B. De Amorim, G. D. Cavalcanti, and R. M. Cruz, “The choice of scaling technique matters for classification performance,” Applied Soft Computing, vol. 133, 2023, Art. no. 109924, doi: 10.1016/j.asoc.2022.109924.
- Y. S. Kim, M. K. Kim, N. Fu, J. Liu, J. Wang, and J. Srebric, “Investigating the impact of data normalization methods on predicting electricity consumption in a building using different artificial neural network models,” Sustainable Cities and Society, vol. 118, 2025, Art. no. 105570, doi: 10.1016/j.scs.2024.105570.
- X. Xiang, H. Yi, J. Hou, C. Peng, H. Huang, and X. Huang, “Uncertainty optimization of vibration characteristics in engineering machinery powertrain mounting systems using Monte Carlo and genetic algorithms,” SAE Int. J. Veh. Dyn., Stab., and NVH, vol. 10, no. 1, 2025, doi: 10.4271/10-10-01-0006.
- D. Abriha, P. K. Srivastava, and S. Szabó, “Smaller is better? Unduly nice accuracy assessments in roof detection using remote sensing data with machine learning and k-fold cross-validation,” Heliyon, vol. 9, no. 3, 2023, Art. no. e14045, doi: 10.1016/j.heliyon.2023.e14045.
- Wilson, D. Schoeman, A. Bradley, and C. Clemente, “Practical guidelines for validation of supervised machine learning models in accelerometer-based animal behaviour classification,” Journal of Animal Ecology, vol. 94, no. 7, pp. 1322-1334, 2025, doi: 10.1111/1365-2656.70054.